Press Kit
The Gold Barometer publishes a daily reading of gold buying conditions from 0 to 100. This page has everything you need to quote it. A one-line sentence for today. Ready-made paragraphs. One number for each of the seven parts. Downloadable assets. A five-line summary of the method. Free to reuse with a credit line.
One-line sentence for today
Direct URL to today's number, for machines: /data/latest.json. For humans: thegoldbarometer.com.
Longer forms
How to credit us
- Credit line. Source: The Gold Barometer, thegoldbarometer.com. Please link to the page, not a screenshot, so readers can check the number.
- License. The score, its parts, the zone label and the history numbers are published under Creative Commons Attribution 4.0 (CC BY 4.0). Free to reuse commercially with a credit line.
- Freshness. The reading changes every day. If your article will be read after today, quote the score with the date, or embed the free daily-updating widget.
Today's numbers, one row per part
The seven parts, in plain words: the yield cash pays after inflation, the entry price, and structural demand from central banks and funds. Then the dollar, trader positioning, price volatility, and the premiums a dealer charges over the metal price.
"Base" is a part's normal weight. When a part drops out for the day, the other parts share its weight.
Copy the CSV below into any spreadsheet, or read it live from /data/latest.json.
| Metric | Value | Notes |
|---|---|---|
| Overall score | 33/100 | Unfavorable zone |
| Date | 2026-10-09 | Method v1.0 |
| Parts used today | 6 / 7 | A stale part drops. The other parts share out its weight |
| Cash after inflation | 32/100 | weight 25% base, 27.8% used today, source date 2026-10-08 |
| Entry price | 34/100 | weight 20% base, 22.2% used today, source date 2026-09-30 |
| Central-bank buying | 46/100 | weight 15% base, 16.7% used today, source date 2026-10-08 |
| US dollar | 32/100 | weight 10% base, 11.1% used today, source date 2026-10-02 |
| Trader bets | 34/100 | weight 10% base, 11.1% used today, source date 2026-10-06 |
| Price jumpiness | 15/100 | weight 10% base, 11.1% used today, source date 2026-10-09 |
| Retail premiums | unavailable | weight 0% base, 0.0% used today, source date 2026-10-09 |
Ready-made paragraphs
Method in 5 bullets
- Seven things measured. Cash yield after inflation, entry price, central-bank buying, US dollar, trader bets, price jumpiness and retail premiums, weighted 25/20/15/10/10/10/10. Retail premiums are new, so they start with almost no say in the score. Their say grows as our record of them grows.
- Ranked against its own past. Each part is compared with every past value of the same part. It is then flipped so that a higher part-score means conditions that led to better long-term returns for a buyer. The overall score is a weighted average.
- Five zones. 0 to 19 Historically very unfavorable, 20 to 39 Unfavorable, 40 to 59 Mixed, 60 to 79 Favorable, 80 to 100 Historically very favorable. Zone table.
- When a source goes stale. Each source has a published age limit. Past that limit, the part drops out and the home page then reads "N of 7 parts used today". Rules.
- Where the framework has been wrong. The method page names each case, with dates. The top zone has never happened in the data. Over one-year stretches, one zone lands out of order. A worse zone shows a better result than the zone above it. The cash-after-inflation link broke down in 2022. Read the section.
History in a few headline numbers
- 82 monthly rebuilds back to October 2019, plus 66 daily live readings since Aug 2026. Full record:
/data/history.csv. - Middle 5-year real gold return from the favorable zone (N=110 months): +48.5%.
- Middle 5-year real gold return from the mixed zone (N=379 months): +19.8%.
- Middle 5-year real gold return from the unfavorable zone (N=153 months): -15.8%.
- Middle 5-year real gold return from the historically very unfavorable zone (N=27 months): -7.7%.
- See the track record for the full numbers per zone, checks against different choices, and the record of what we got wrong.
Assets
Everything below is free to reuse with a credit to The Gold Barometer (CC BY 4.0 on the images built from the data).

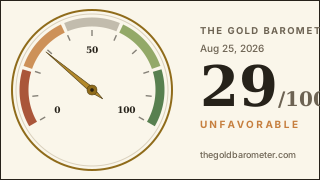
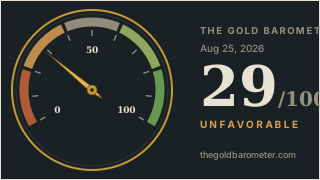
The dials update once per day. If you need a print-resolution PNG or a snapshot from a past date, email hello@thegoldbarometer.com and we will send it.
Quarterly report
A report fixes one reading and the record behind it. Its figures do not change after publication, so a quote from it stays true to its date. Who publishes it is on the about page.
Public data links
GET /data/latest.json: today's score, zone, each part-score, weights and source ages. Open to any site.GET /data/history.json: the full archive, live and rebuilt readings.GET /data/history.csv: the same as history.json, in CSV.- Public GitHub archive: github.com/thegoldbarometer/data. One commit per daily reading. Every reading has a permanent time-stamp.
- Full API notes and terms: /data/.
Contact
Press and data questions: hello@thegoldbarometer.com. Journalists on deadline: we will walk you through the formula, the choices, and the evidence, in whatever detail helps.
Published independently. No dealer, mint or broker pays for placement, and none sees a reading before it goes out. What the score is made of is on the method page. Where each number comes from is on the provenance page. Every change we have made to a published reading is listed in the corrections log.
One-line summary of what makes it different
The formula, the weights, the sources, the full history and the record of what has been wrong are all on this site. No dealer sets the price or the score. That is not a slogan. Every item in that list is a file you can open from this page.